

How to Map Customer Touchpoints With Digital Analytics for Success
Mapping customer touchpoints is a powerful way to understand how people interact with your business in the digital world. Every click, scroll, and action on your website or app tells a story about what your customer wants, what stops them, and what makes them come back. For companies aiming to grow and improve customer experience, using digital analytics to map these touchpoints is not just helpful—it’s essential.
But getting this right is more than tracking visits or counting pageviews. It’s about connecting the dots across platforms, channels, and devices. This article will show you how to map customer touchpoints step by step, using digital analytics as your guide.
You’ll learn practical methods, see real examples, and discover insights that can boost your marketing, sales, and customer service. Whether you’re new to analytics or looking to make your data work harder, this guide will help you build a clear, actionable map of your customer journey.
What Are Customer Touchpoints?
A customer touchpoint is any moment when a customer interacts with your brand. These can be digital, like viewing a Facebook ad, visiting your website, receiving an email, or using your mobile app. Touchpoints can also be offline, such as calling support or visiting a physical store, but this article focuses on digital touchpoints, where analytics give us the most detailed data.
Understanding touchpoints is crucial because each one can influence how a customer feels about your brand. Some touchpoints are “first impressions” (like an Instagram ad), while others are “last steps” before a sale (like completing checkout). Mapping these moments helps you see the full customer journey—not just isolated interactions.
Examples Of Digital Touchpoints
- Social media ads
- Search engine results
- Landing pages
- Email campaigns
- Live chat on your website
- App notifications
- Online reviews or comments
Every one of these touchpoints can be tracked and measured with the right digital analytics tools.
Why Mapping Touchpoints Matters
Many businesses focus on the obvious actions: purchases, signups, or downloads. But this leaves out the “why” behind each action. By mapping touchpoints, you see the path customers take—not just the end result.
Here are some reasons why mapping matters:
- Identify drop-off points: See where users lose interest or get stuck.
- Optimize marketing: Understand which channels actually lead to sales.
- Personalize experiences: Show the right message to the right person at the right time.
- Measure ROI: Connect marketing efforts directly to business results.
- Improve customer satisfaction: Find and fix friction points before they hurt your reputation.
A 2026 report by McKinsey found that companies using advanced journey analytics increased customer satisfaction scores by up to 20% and reduced churn by 15%. This shows that the effort pays off.
The Role Of Digital Analytics
Digital analytics is the process of collecting, analyzing, and interpreting data from online sources. Tools like Google Analytics, Adobe Analytics, and Mixpanel help businesses track user behavior across websites, apps, and campaigns.
Without analytics, mapping touchpoints becomes guesswork. With analytics, you can:
- Track every digital interaction
- Follow users across channels and devices
- Measure engagement and conversion rates
- Identify patterns and trends
- Test changes and see what works
But analytics alone isn’t enough. You need a clear method to connect the data to real customer journeys.
Step 1: Define Your Customer Journey Stages
Before tracking touchpoints, outline the stages your customers go through. Every business is different, but most journeys follow a similar pattern:
- Awareness: The customer discovers your brand.
- Consideration: They learn more and compare options.
- Decision: They decide to buy or take action.
- Retention: They come back for more.
- Advocacy: They recommend you to others.
You can customize these stages for your business. For example, a SaaS company might have “Free Trial” as a separate stage. An e-commerce store might add “Cart Abandonment. ”
Mapping stages helps you see which touchpoints belong where. It also shows you where you have gaps—places where customers drop out or get stuck.
Step 2: List All Digital Touchpoints
Next, identify every digital touchpoint a customer might encounter during each stage. Don’t just focus on your main website—think about the entire digital ecosystem.
Example: E-commerce Store Touchpoints
| Journey Stage | Key Digital Touchpoints |
|---|---|
| Awareness | Google Ads, Facebook Ads, Instagram posts, Influencer mentions |
| Consideration | Product pages, Reviews, FAQs, Blog articles |
| Decision | Cart page, Checkout form, Promo emails, Live chat |
| Retention | Order confirmation, Loyalty emails, App notifications |
| Advocacy | Review requests, Referral programs, Social sharing buttons |
This table helps you visualize where each touchpoint fits in the journey. Repeat this process for your own business.
Non-obvious Insights
- Some touchpoints, like mobile push notifications, only appear for certain segments. Don’t overlook these micro-moments.
- Touchpoints often overlap. For example, an email campaign might serve both retention and advocacy if it includes referral links.
Step 3: Set Up Analytics Tracking
Now, use digital analytics tools to track each touchpoint. The right setup ensures you capture the data you need.
Core Tracking Methods
- Pageview tracking: Measures visits to web pages.
- Event tracking: Records actions like clicks, video plays, form submissions.
- Campaign tracking: Uses UTM parameters to see where users come from.
- User ID tracking: Connects data across devices (with user consent).
- Funnel tracking: Shows how users move from one step to another.
Most businesses use tools like Google Analytics, but for deeper insights, consider platforms like Mixpanel, Amplitude, or Adobe Analytics.
Example: Setting Up Event Tracking
Say you want to track every time a user clicks “Add to Cart. ” In Google Analytics 4, you’d set up a custom event trigger. This data helps you see which products get attention but don’t always convert.
Practical Tips
- Track both macro-conversions (like purchases) and micro-conversions (like newsletter signups).
- Use consistent naming for events and goals, so reports are clear.
- Test your tracking regularly. A broken tag or missing script can lead to lost data.
Step 4: Connect Touchpoints Across Channels
Customers often switch between devices and channels. They might see your Instagram ad on their phone, read your blog on a laptop, then buy through your app. Mapping these journeys means connecting data from all sources.
Multi-channel Attribution
Attribution is the process of giving credit to the touchpoints that lead to conversions. There are several common models:
| Attribution Model | Description | Best For |
|---|---|---|
| Last Click | Gives all credit to the final touchpoint before conversion. | Simple journeys |
| First Click | Gives credit to the first interaction. | Brand awareness campaigns |
| Linear | Spreads credit equally across all touchpoints. | Long, complex journeys |
| Time Decay | Gives more credit to recent touchpoints. | Fast-moving industries |
| Data-Driven | Uses machine learning to assign credit based on impact. | Large datasets |
Choosing the right model depends on your goals. For most businesses, linear or data-driven models give a more accurate picture than last-click alone.
Cross-device Tracking
To connect users across devices, use features like User ID in Google Analytics or login-based tracking. This links sessions from the same person, even if they switch from mobile to desktop.
Non-obvious Insight
- Focusing only on “last-click” touchpoints often undervalues upper-funnel activities like content marketing or display ads. These early interactions are crucial for building trust, even if they don’t lead to instant sales.
Step 5: Visualize The Customer Journey
Data is only useful if you can see the patterns. Visualizing touchpoints helps you spot bottlenecks, opportunities, and gaps.
Popular Visualization Methods
- Customer journey maps: Diagrams showing each touchpoint along the journey.
- Funnels: Charts that show how many users move from one step to the next.
- Path analysis: Visualizes the most common routes users take.
Most analytics platforms have built-in visualization tools. For more advanced mapping, tools like Lucidchart, Miro, or Smaply help create custom journey maps.
Example: Funnel Visualization
An e-commerce site might track:
- Product page views
- Add to cart
- Begin checkout
- Complete purchase
If you see a big drop between steps 2 and 3, you know where to focus your optimization efforts.
Practical Tips
- Update your maps as new touchpoints emerge (e.g., TikTok campaigns, new app features).
- Involve team members from different departments—marketing, sales, support—to get a full view.
- Use color or icons to highlight high-impact or problematic touchpoints.
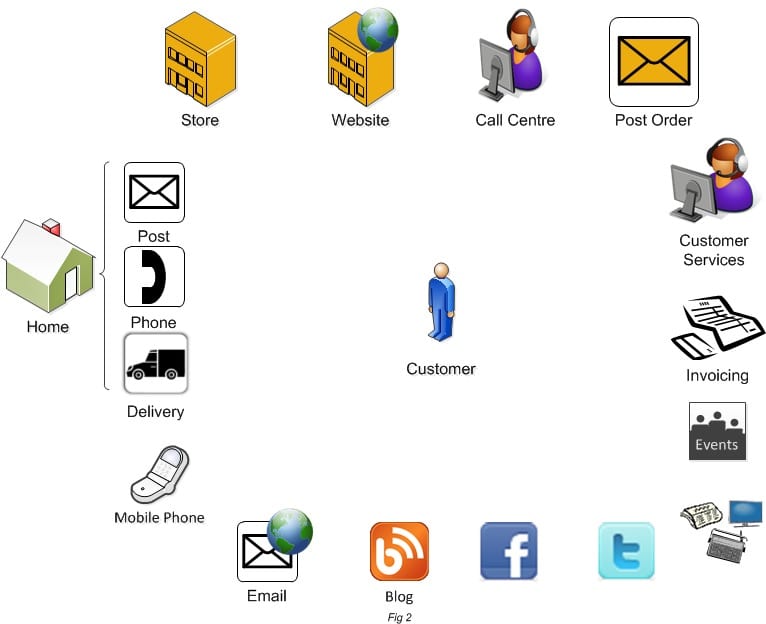
Credit: www.smartinsights.com
Step 6: Analyze And Optimize Each Touchpoint
Once you’ve mapped and visualized the journey, the real work begins: improving each touchpoint.
Key Questions To Ask
- Where do users drop off most?
- Which channels bring the highest-value customers?
- Are certain touchpoints causing confusion or frustration?
- Which interactions lead to repeat purchases or referrals?
Use A/B testing, customer feedback, and session recordings to dig deeper.
Example: Optimizing A Checkout Page
If analytics show that 40% of users abandon their cart at the payment step, try:
- Reducing the number of form fields
- Adding trust badges or testimonials
- Offering guest checkout
- Improving mobile usability
Measure the results to see if changes increase completion rates.
Non-obvious Insight
- Sometimes, removing a touchpoint (such as a required signup) improves the journey more than adding new features.
Step 7: Measure Success And Iterate
Mapping touchpoints is not a one-time project. Customer behavior changes, new channels appear, and business goals shift. Review your maps and analytics regularly.
Key Metrics To Track
- Conversion rate: Percentage of users who complete a desired action.
- Customer lifetime value (CLV): Total value a customer brings over time.
- Churn rate: How many customers leave or stop using your service.
- Net Promoter Score (NPS): Measures loyalty and advocacy.
Set benchmarks, measure progress, and adjust your strategies as needed.
Example: Iterative Improvement
A SaaS company finds that users drop off during onboarding. By simplifying tutorials and adding tooltips, they boost activation rates by 18% over three months.
Practical Tips
- Celebrate small wins. Even a 1% increase in conversion can have a big impact at scale.
- Document changes and results, so your team knows what works.
Common Challenges In Mapping Digital Touchpoints
Mapping is powerful, but it’s not always easy. Here are some hurdles and how to handle them:
1. Data Silos
When marketing, sales, and support use different tools, it’s hard to see the full journey. Solution: Integrate your systems or use analytics tools that pull data from multiple sources.
2. Privacy Regulations
Laws like GDPR and CCPA affect what data you can collect. Always get consent, anonymize personal data, and stay updated on regulations.
3. Tracking Limitations
Ad blockers, cookie restrictions, and iOS privacy settings can make tracking harder. Use server-side tracking, first-party cookies, and focus on aggregated (not personal) data.
4. Analysis Paralysis
Too much data can overwhelm. Start with the most important touchpoints, then expand.
Non-obvious Insight
- Sometimes, the most valuable insights come from qualitative data—such as user interviews or feedback forms—not just analytics numbers. Combine both for the best results.
Real-world Case Study: Mapping Touchpoints At An Online Retailer
Let’s look at how an online clothing retailer used digital analytics to map and improve their customer journey.
The Challenge
The retailer noticed that although website traffic was growing, sales were flat. Many users visited, browsed products, but didn’t buy.
The Approach
- Defined journey stages: Awareness (ads), Consideration (product pages), Decision (checkout), Retention (emails), Advocacy (reviews).
- Listed touchpoints: Tracked ads, email opens, page visits, cart additions, and more.
- Set up tracking: Used Google Analytics and Facebook Pixel to connect data.
- Connected channels: Mapped which combinations of ads, emails, and site visits led to sales.
- Visualized funnels: Saw a big drop at checkout.
- Optimized touchpoints: Simplified the checkout, added payment options, and improved cart reminders.
- Measured results: Conversion rates increased by 12% in two months.
Lessons Learned
- Most buyers interacted with at least three touchpoints before purchasing.
- Mobile visitors dropped off more than desktop users, leading to a mobile-first redesign.
- Referral program emails boosted advocacy, leading to a 7% increase in repeat buyers.
Tools And Technology For Mapping Touchpoints
Choosing the right tools makes mapping easier. Here’s a comparison of popular platforms:
| Tool | Best For | Key Features | Pricing |
|---|---|---|---|
| Google Analytics 4 | Most businesses | Event tracking, funnels, cross-device analysis | Free |
| Mixpanel | Product analytics | Advanced segmentation, cohort analysis | Free & Paid |
| Adobe Analytics | Enterprises | Deep analysis, integration with Adobe suite | Paid |
| Hotjar | UX insights | Session recordings, heatmaps | Free & Paid |
| HubSpot | Marketing & CRM | Journey mapping, CRM integration | Free & Paid |
When choosing, look for:
- Integration with your website/app
- Support for multi-channel and cross-device tracking
- Customizable reports and visualizations
- Compliance with privacy laws
For advanced needs, consider combining tools (e. g. , Google Analytics + Hotjar).
How To Get Buy-in For Touchpoint Mapping
Mapping journeys often requires support from leadership and other teams. Here’s how to get buy-in:
- Show business value: Use examples and data to prove the ROI.
- Start small: Map a single journey before scaling up.
- Involve stakeholders: Include marketing, sales, support, and IT early.
- Share wins: Report improvements in conversion, retention, or satisfaction.
Leaders are more likely to support touchpoint mapping when they see how it improves customer experience and revenue.

Credit: slidebazaar.com
Advanced Tactics For Mapping And Analysis
As your analytics skills grow, consider these advanced tactics:
1. Segmentation
Break down touchpoints by segment—such as new vs. returning users, or by location. This reveals hidden patterns.
2. Predictive Analytics
Use machine learning tools to predict which touchpoints lead to conversion or churn. Google Analytics and Mixpanel offer predictive features.
3. Real-time Analysis
Monitor live data to spot issues (like a broken link) as soon as they happen.
4. Data Enrichment
Combine analytics with CRM or support data for a complete view. For example, overlay support ticket data on your journey map to see where users need help.
5. Attribution Testing
Regularly test different attribution models to see which fits your business best.
Key Metrics To Monitor For Each Touchpoint
To get the most from your touchpoint mapping, track these metrics for each interaction:
- Engagement rate: How often users interact with each touchpoint.
- Time on page/screen: Indicates interest or confusion.
- Click-through rate (CTR): Shows effectiveness of links, ads, or emails.
- Conversion rate per touchpoint: Which steps lead to action.
- Drop-off rate: Where users leave the journey.
- Customer satisfaction (CSAT): Direct feedback on interactions.
Review these regularly to spot trends and areas for improvement.
Integrating Qualitative Feedback
Numbers tell part of the story. To truly understand your customer journey, combine analytics with qualitative feedback:
- Run surveys after key touchpoints (like checkout or support chat).
- Analyze chat transcripts for common frustrations.
- Conduct user interviews to understand motivations.
This feedback helps you explain “why” users behave a certain way—and guides smarter optimization.
Privacy, Ethics, And Customer Trust
As you map and track touchpoints, respect your customers’ privacy. Always:
- Use clear consent banners for cookies and tracking.
- Let users opt out or request data deletion.
- Store data securely and anonymize when possible.
Not only does this keep you legal, it also builds trust with customers. For up-to-date privacy rules, check resources like the Federal Trade Commission.
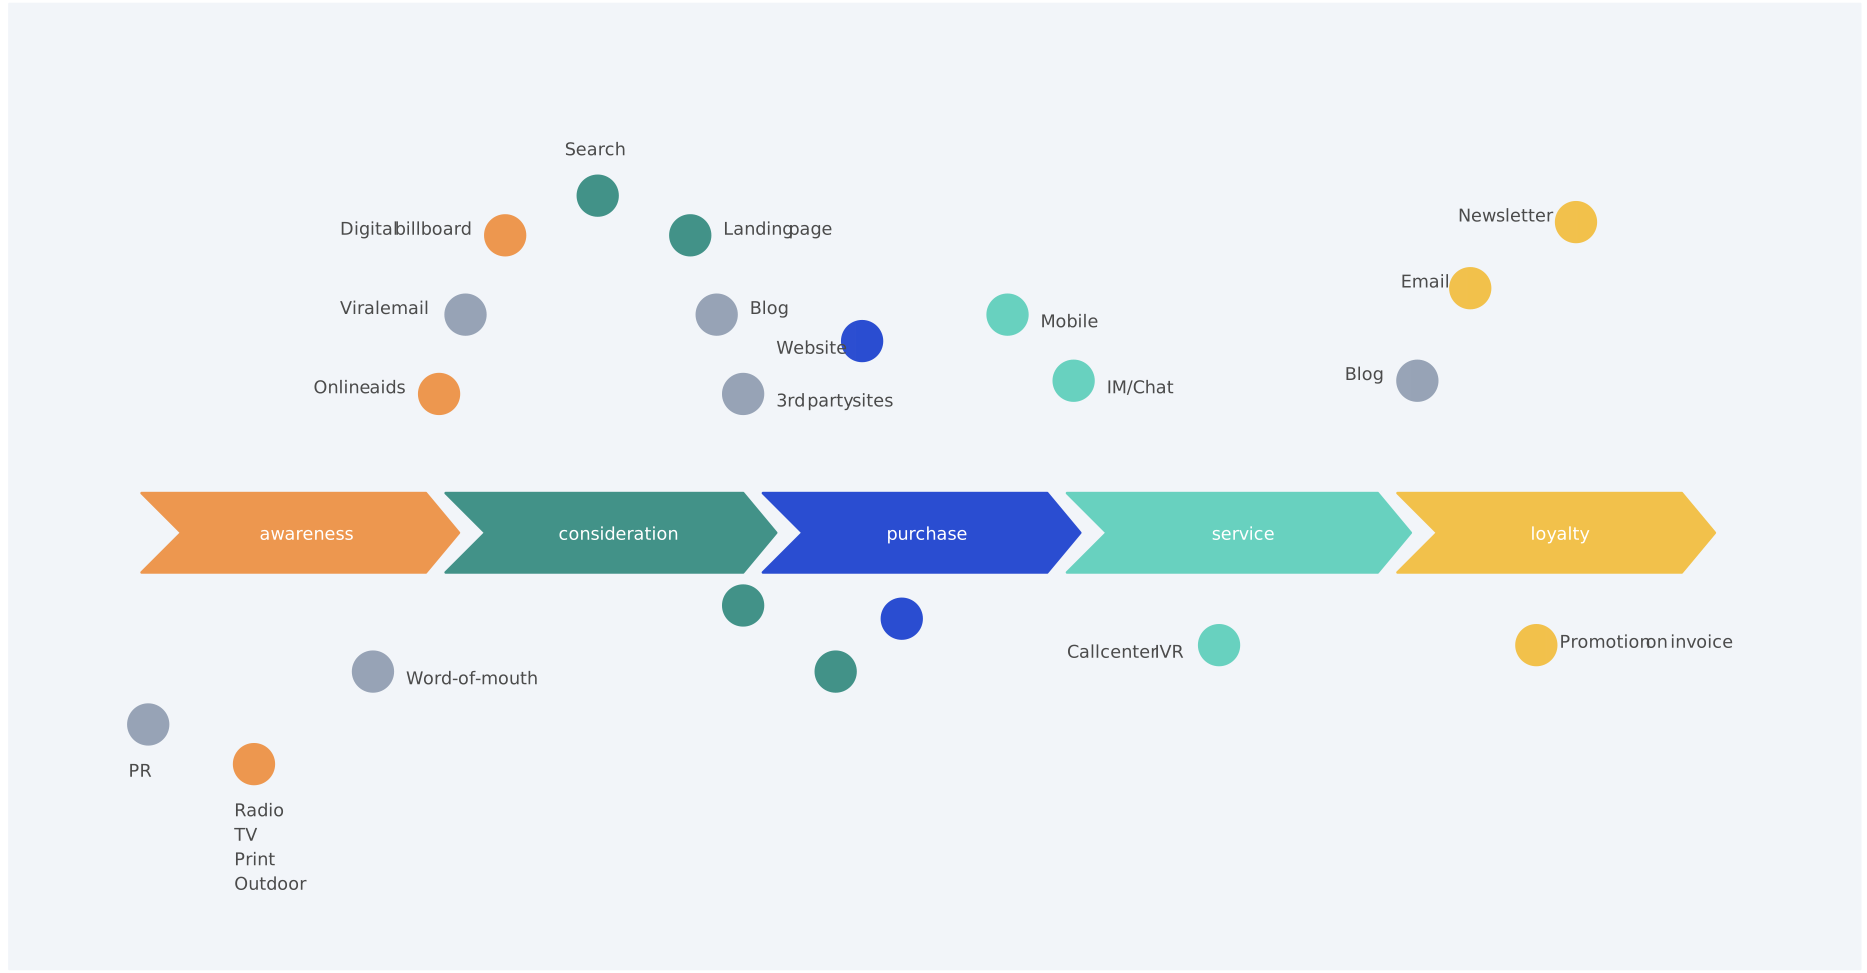
Credit: creately.com
Frequently Asked Questions
How Do I Start Mapping Customer Touchpoints If I Have No Analytics Set Up?
Begin by listing all possible digital interactions a customer can have with your brand (website, social, email, etc. ). Then, set up a basic analytics tool like Google Analytics to start tracking visits and actions. As you gather data, refine your map and add more detailed tracking.
What Is The Difference Between A Touchpoint And A Customer Journey Stage?
A touchpoint is a single interaction (like clicking an ad or opening an email), while a customer journey stage is a broader phase in the buying process (like Awareness or Decision). Touchpoints happen within stages.
How Often Should I Update My Customer Journey Maps?
Update your maps at least every 6-12 months, or whenever you launch new channels, products, or campaigns. Regular updates ensure your journey reflects real customer behavior.
Can I Map Offline And Online Touchpoints Together?
Yes. While this article focuses on digital touchpoints, many analytics tools let you import offline data (like in-store purchases or phone support) to build a complete journey. This gives a fuller picture of your customer’s experience.
What If I Have Limited Resources For Mapping And Analytics?
Start with your most important touchpoints (like checkout or lead forms) and basic analytics tools. As you see results, invest in more advanced tracking and mapping. Even small improvements can lead to big gains over time.
Mapping customer touchpoints with digital analytics is a journey in itself. The more you learn about your customers, the better you can serve them—and the stronger your business will become. By following these steps, you’ll gain clarity, spot new opportunities, and create experiences that keep people coming back.


About author








Add comment